


By: Arif Khan
Last night my friend visited me, I was very happy to see him after a long time, we shared many things about our professional and routine life, suddenly he asked me about getting live coin market rates on the web page, I told him that I can write him a python script by which he could get the live coin rates and could use that script in his web site, he was very happy to hear that, i wrote a python script for him. Then I thought why not I publish this script, so that anybody can take its advantage. Following is the code which i wrote for him and step by step code understanding for anybody who might need this. Let’s begin.
Building Environment:
First of all we need following python libraries to achieve our goal.
- Python environment.
- Pandas.
- Matplotlib.
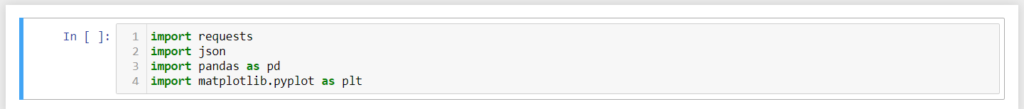
Python Libraries:
Do imports first as below code.
Define Variables:
Now define variables as

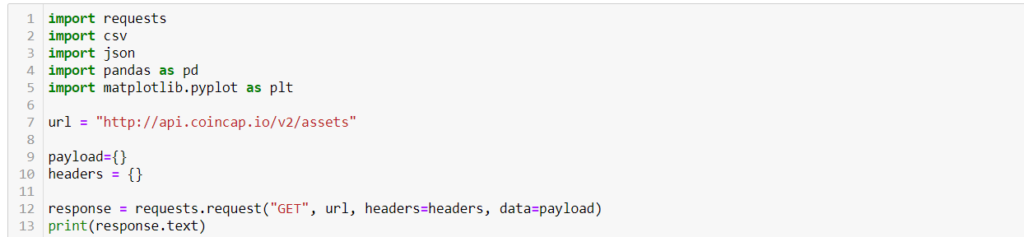
As you see above I am using CoinCap API. For understanding about API usage read its documentation https://documenter.getpostman.com/view/5586338/RWgwQb97
Getting selected Coin Rates:
If you need to get all coin rates use abode as it is, but if you need to get only one coin rates then you need to use it as below.

Full Code:
Now merge all code together as

After execution you will find below response from API.
Json Respons:
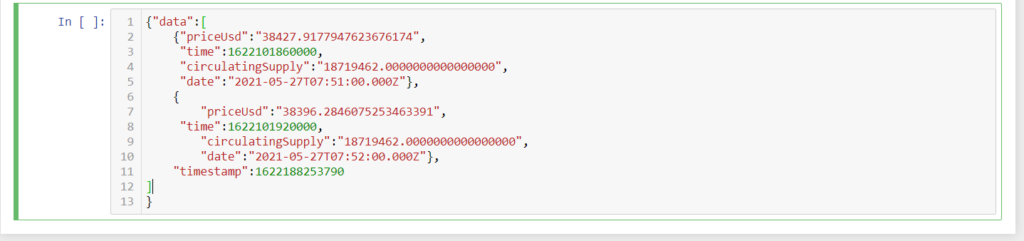
API Response Bitcoin rates time series data in json format:
Getting all coin Rates:
If you want to get all coin’s rates at once then you need to modify url like below:
After execution you will get below response from API.
Json Response for all Coin Rates:
API Response all coins rates time series data in json format:

Beautification of Json Response:
The response is not understandable for everybody. Let’s make it understandable and also make it’s line chart for better understanding.
Let’s parse json response and convert into pandas data frame as below:
Below line will convert json response into utf8 encoded text and store it into variable named json_data

Now extract key value of “data” into variable named bitdata as below. It will extract list of dictionary into variable which laying under the key named as “data” in json response. You can also check it’s data by executing print(bitdata) in notebook cell.

You will get the output of bitdata by executing print(bitdata) will be as below. Notice that the key “data” is not there, it is just a list of dictionaries.

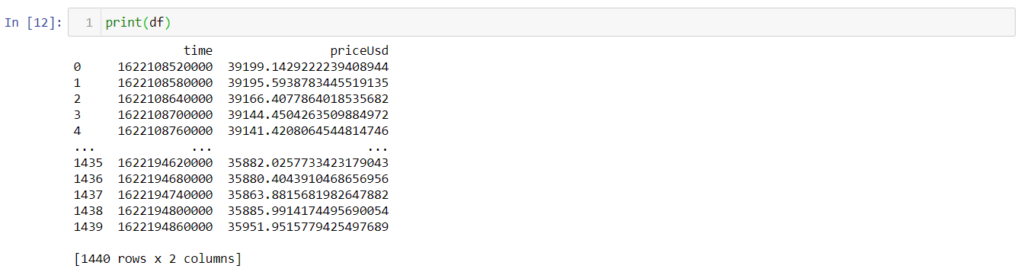
We can now convert bitdata into pandas dataframe. I am extracting just two columns from bitdata as I will make its line chat, if you don’t want make chart then you wouldn’t need to use columns parameter.

Use below to see the data in df.
Now we can use this data to build our BitCoin line chart, but hold on please, first we need to check the data types of all columns returned by pandas as we can just use numeric data to build the charts. Let’s see what type of data is there.

Oh no. bad news, we can’t build our chart out from object datatype as you see the priceUsd column is a object. But don’t worry we have a solution of this problem, we need to change the data type of priceUsd to numeric by executing below cell it will change the said column datatype from object to float64:


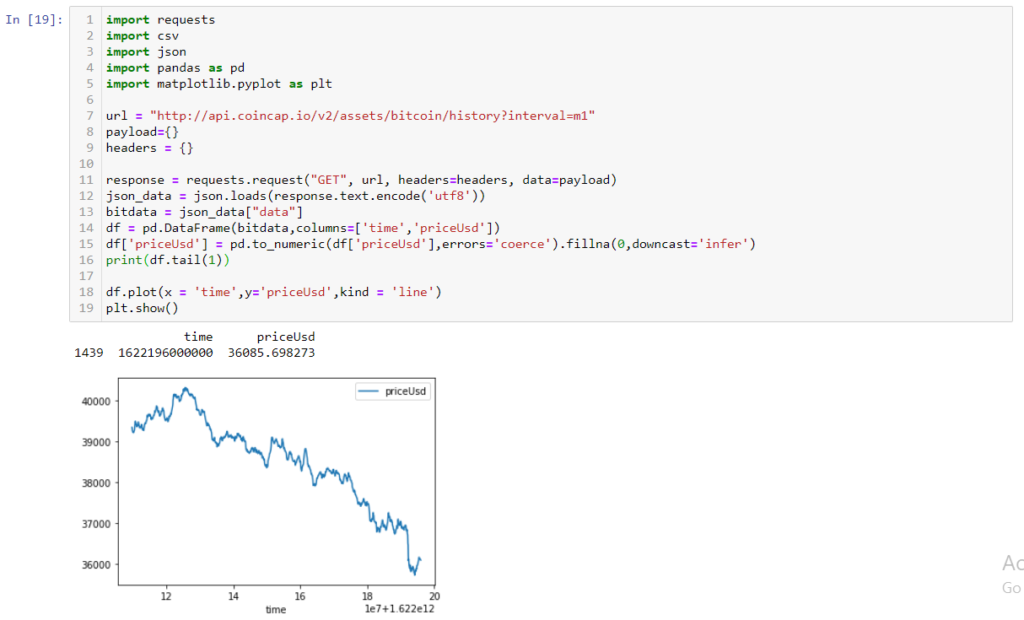
As you see above the column data type is changed, now we can build its chart using python matplotlib. In our imports we have already imported matplotlib.pyplot as plt, now it’s time to use it. Let’s see how by writing just two lines of code magic will happen.

Now its time to combine all line of codes together full python script will look like:
Hope this article will help you to increase your knowledge and you will take benefit from this.
Hearing from you will be my pleasure, If you have any comments or questions, please post below.
Enjoy and happy coding.


Great Work Arif Bhai.
Thanks a lot my friend
Hello. excellent job. I did not imagine this. This is a remarkable story. Thanks!